Irrigation Canal Liner Anchorage & Flow Velocity Design Guide
Application Guide 2026-10-12
📌 Article Positioning
This guide focuses on anchorage design, flow velocity, and mechanical protection for irrigation canal HDPE liners — drag forces, anchorage requirements, textured liner applications, and mechanical damage prevention. For thickness selection and cost analysis (0.75mm vs 1.0mm vs 1.5mm, lifecycle economics, water savings), refer to the companion guide on irrigation canal liner thickness selection.
📋 Executive Summary — For Engineers in a Hurry
- Flow velocities > 1.5 m/s require enhanced anchorage — standard trench anchors are insufficient for drag forces at higher velocities
- Anchorage design must account for maximum expected velocity — not average operating conditions
- Textured liners are recommended for velocities > 2.0 m/s — smooth liners may experience uplift and displacement
- Mechanical damage from equipment and debris is a leading cause of canal liner failure (25–30%)
- CQA requirements include 100% non-destructive seam testing, destructive testing every 150m, and subgrade verification
- Water savings from seepage control typically recover liner cost within 3–7 years
⚠️ Critical Engineering Statement — Flow Velocity Determines Anchorage Design, Not Liner Thickness
Irrigation canal liners are exposed to drag forces from flowing water. These forces increase with the square of velocity. Anchorage design must account for maximum expected velocity.
- Drag force increases with velocity squared — doubling velocity quadruples drag force
- Standard trench anchors are sufficient for velocities < 1.5 m/s
- Enhanced anchorage (trench + batten bars) is required for 1.5–2.0 m/s
- Textured liners are recommended for velocities > 2.0 m/s
- Maximum velocity requires special design — velocities > 2.5 m/s require site-specific analysis
- Anchorage failure causes liner uplift and seam separation — often within a single high-flow event
A 1.0mm liner with proper anchorage will outperform a 1.5mm liner with inadequate anchorage. Anchorage design and installation quality outweigh thickness alone.
⚠️ Flow Velocity and Anchorage Design — Irrigation Canal Unique Requirement
Flow velocity is a unique irrigation canal consideration that does not apply to most other lined containment applications. Canal liners are exposed to continuous drag forces from flowing water.
Flow Velocity Effects on Liner:
| Flow Velocity | Drag Force | Anchorage Requirement |
|---|---|---|
| < 1.0 m/s | Low | Standard trench anchors |
| 1.0–1.5 m/s | Moderate | Standard trench anchors |
| 1.5–2.0 m/s | High | Enhanced anchorage (trench + batten bars) |
| 2.0–2.5 m/s | Very High | Textured liners + enhanced anchorage |
| > 2.5 m/s | Extreme | Site-specific design required |
Table scrolls horizontally on mobile
Anchorage Design Requirements:
| Parameter | Standard | Enhanced | Textured |
|---|---|---|---|
| Velocity range | < 1.5 m/s | 1.5–2.0 m/s | > 2.0 m/s |
| Trench depth | 0.5–0.6m | 0.8–1.0m | 1.0–1.2m |
| Batten bars | Optional | Required | Required |
| Anchor spacing | 1.0–1.5m | 0.8–1.0m | 0.6–0.8m |
| Liner type | Smooth | Smooth | Textured |
Table scrolls horizontally on mobile
Implementation Guidance:
- ✅ Design for maximum velocity: Use peak flow velocity (monsoon, flood) not average operating velocity
- ✅ Trench anchors: Standard trench anchors for < 1.5 m/s; deeper trench for higher velocities
- ✅ Batten bars: Required for velocities > 1.5 m/s; installed at regular intervals
- ✅ Textured liners: Recommended for velocities > 2.0 m/s; provides additional friction
- ✅ Seam orientation: Orient seams parallel to flow direction to minimise drag on seams
Case Reference: Indian canal experienced 2.2 m/s monsoon flow velocity. Standard anchorage was insufficient, causing liner uplift and seam separation. Repair cost was $1.5M.
⚠️ Water Savings Economics — Irrigation Canal Core Value
Seepage control is the primary economic driver for irrigation canal liners. Water savings typically recover liner cost within 3–7 years.
Seepage Loss Comparison:
| Canal Type | Seepage Loss (% of flow) | Water Loss per km (m³/year) |
|---|---|---|
| Unlined (earth) | 30–50% | 45,000–75,000 |
| Clay-lined | 10–20% | 15,000–30,000 |
| HDPE-lined | < 1% | < 1,500 |
Water Savings Economics:
For a 1 km canal (3m wide, 1.5m depth, 2 m³/s flow):
| Parameter | Value |
|---|---|
| Annual water conveyed | 63 million m³ |
| Unlined seepage loss (40%) | 25 million m³ |
| HDPE-lined seepage loss (< 1%) | 0.6 million m³ |
| Annual water savings | 24.4 million m³ |
| Water value ($0.10/m³) | $2.44M |
| Water value ($0.05/m³) | $1.22M |
| Liner cost (1.0mm, $22/m²) | $330,000 |
| Recovery period (at $0.10/m³) | < 1 year |
| Recovery period (at $0.01/m³) | 3–7 years |
Table scrolls horizontally on mobile
US Success Case: US Southwest irrigation district installed 1.0mm HDPE in 2016. Ten-year monitoring showed zero punctures and water savings of 75% compared to unlined canal.
📑 Table of Contents
1️⃣ Search Intent Introduction
2️⃣ Common Engineering Questions About Canal Liner Anchorage
3️⃣ Why HDPE Is Used — Material Science Focus
4️⃣ Flow Velocity and Drag Force Analysis
5️⃣ Anchorage Design Requirements
6️⃣ Textured Liners for High Velocity Applications
7️⃣ Mechanical Damage Prevention
8️⃣ Real Engineering Failure Cases
9️⃣ Comparison With Alternative Liner Systems
🔟 Cost Considerations for Anchorage
1️⃣1️⃣ Professional Engineering Recommendation
1️⃣2️⃣ FAQ Section
1️⃣3️⃣ Technical Conclusion
1️⃣ Search Intent Introduction
This guide addresses the specification-level decision making for HDPE geomembrane anchorage design and flow velocity management in irrigation canal applications. The primary audience includes agricultural engineers, water resources consultants, EPC contractors, irrigation district managers, and facility owners evaluating liner systems for water conveyance.
Understanding flow velocity effects is essential for anchorage design, liner selection, and CQA program design. This is not an introductory overview — it is a data-driven engineering reference for professionals designing and specifying irrigation canal containment systems.
Real-world stress conditions unique to irrigation canals include:
- ✅ Continuous UV exposure — exposed liner receives full solar radiation
- ✅ Mechanical damage risk — equipment access, debris, and maintenance activities
- ✅ Rapid water level fluctuations — daily and seasonal fill/drawdown cycles
- ✅ Flow velocity drag forces — velocities up to 2.5 m/s create drag on the liner
- ✅ Anchorage loading — drag forces transferred to anchorage system
- ✅ Temperature fluctuations — daily and seasonal cycling from 5°C to 45°C
2️⃣ Common Engineering Questions About Canal Liner Anchorage
Q1: What flow velocity requires enhanced anchorage?
Standard trench anchors are sufficient for velocities < 1.5 m/s. For 1.5–2.0 m/s, enhanced anchorage (deeper trench + batten bars) is required. For velocities > 2.0 m/s, textured liners are recommended.
Q2: How is drag force calculated for canal liners?
Drag force is calculated as F = 0.5 × ρ × V² × Cd × A, where ρ is water density, V is velocity, Cd is drag coefficient, and A is wetted area. Drag force increases with velocity squared.
Q3: What is the maximum velocity for HDPE canal liners?
HDPE canal liners can accommodate velocities up to 2.5 m/s with proper anchorage and textured liners. Velocities > 2.5 m/s require site-specific design and may require alternative materials.
Q4: How does anchorage design differ for high-velocity canals?
High-velocity canals require: deeper trench anchors (1.0–1.2m), batten bars at regular intervals, textured liners for additional friction, and seam orientation parallel to flow direction.
Q5: What is the role of batten bars in canal anchorage?
Batten bars distribute drag forces along the anchorage system. They are required for velocities > 1.5 m/s and prevent localised stress concentrations at anchor points.
Q6: How do textured liners improve high-velocity performance?
Textured liners increase interface friction between the liner and subgrade, reducing the anchorage load. They are recommended for velocities > 2.0 m/s.
Q7: What causes mechanical damage in canal liners?
Mechanical damage sources include: equipment access for maintenance, debris in flow, animal activity, and vandalism. Equipment access is the leading cause (25–30% of failures).
Q8: How can mechanical damage be prevented?
Mechanical damage prevention includes: designated access ramps with protective mats, debris removal upstream, protective covers for exposed sections, and thicker liners (1.5mm) for high-access areas.
Q9: What CQA requirements apply to canal liner anchorage?
CQA requirements include: anchorage depth verification, batten bar spacing verification, anchor spacing verification, and pullout testing for critical anchors.
Q10: How does seepage control economics justify liner cost?
Unlined canals lose 30–50% of conveyed water. Lined canals lose < 1%. Water savings typically recover liner cost within 3–7 years, depending on water value.
3️⃣ Why HDPE Is Used — Material Science Focus
HDPE dominates irrigation canal liner applications due to its excellent chemical resistance, low permeability, and weldability. However, its anchorage requirements for high-velocity applications require careful design.
Chemical Resistance in Irrigation Canals: HDPE resists the full range of irrigation water constituents, including fertilizers (nitrates, phosphates), pesticides, and herbicides. The combination of agricultural chemicals, UV exposure, and temperature fluctuations creates a challenging environment for long-term performance.
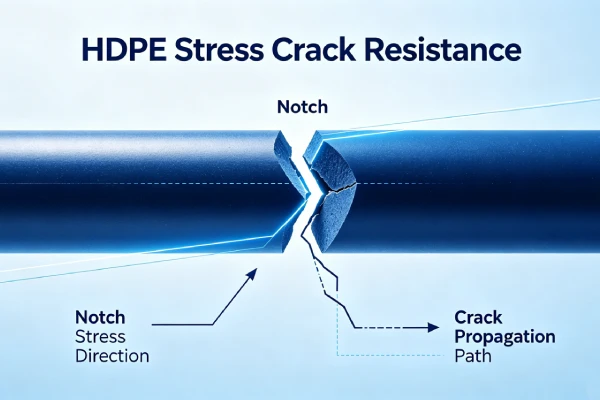
Stress Crack Resistance (NCTL per ASTM D5397): GRI-GM13 requires NCTL ≥ 500 hours. For irrigation canals with agricultural chemical exposure, NCTL ≥ 750 hours is recommended. For high-temperature or aggressive chemical exposure, NCTL ≥ 1000 hours.
Oxidative Induction Time (OIT vs HP-OIT): HP-OIT (ASTM D5885) measures remaining antioxidant capacity. GRI-GM13 requires HP-OIT ≥ 400 minutes. For irrigation canals at 25–40°C, HP-OIT ≥ 450 minutes is recommended.
Carbon Black Content: Carbon black (2–3%, ASTM D4218) provides UV protection. Proper dispersion (ASTM D5596 rating ≥ 1) ensures uniform UV protection — critical for exposed canal liners.
Alternatives Comparison: HDPE vs Other Liner Materials for Irrigation Canals
| Property | HDPE | LLDPE | fPP | PVC | GCL |
|---|---|---|---|---|---|
| Key limitation | Anchorage requirements | Lower NCTL | Lower tensile strength | Plasticizer loss | Shear sensitivity |
| UV resistance | Excellent | Moderate | Good | Poor | N/A |
| Field weldability | Excellent | Excellent | Fair | Good (solvent) | N/A |
| Cost relative to HDPE | 1.0x | 1.0–1.1x | 1.5–2.0x | 1.2–1.5x | 0.6–0.8x |
4️⃣ Flow Velocity and Drag Force Analysis
Flow velocity creates drag forces on the canal liner. These forces must be resisted by the anchorage system.
Drag Force Calculation:
Drag force on the liner is calculated as:
F = 0.5 × ρ × V² × Cd × A
Where:
- F = Drag force (N)
- ρ = Water density (1,000 kg/m³)
- V = Flow velocity (m/s)
- Cd = Drag coefficient (0.005–0.02 for smooth liners)
- A = Wetted area (m²)
Drag Force by Velocity:
| Velocity (m/s) | Drag Force per m² (N) | Anchorage Requirement |
|---|---|---|
| 0.5 | 0.6–2.5 | Standard |
| 1.0 | 2.5–10 | Standard |
| 1.5 | 5.6–22.5 | Standard (upper limit) |
| 2.0 | 10–40 | Enhanced |
| 2.5 | 15.6–62.5 | Textured + enhanced |
Table scrolls horizontally on mobile
Anchorage Load Calculation:
The anchorage system must resist the total drag force on the liner. For a 100m canal section with 3m wetted perimeter at 2.0 m/s:
Total drag force = 10–40 N/m² × 300 m² = 3,000–12,000 N
This force must be distributed across the anchorage system.
Flow Velocity Measurement Methods:
| Method | Application | Accuracy |
|---|---|---|
| Current meter | Manual measurement | ± 5% |
| Acoustic Doppler | Continuous monitoring | ± 2% |
| Float method | Quick estimate | ± 15% |
| Weir/Flume | Structure-based | ± 5% |
| Historical data | Design basis | ± 20% |
Table scrolls horizontally on mobile
5️⃣ Anchorage Design Requirements
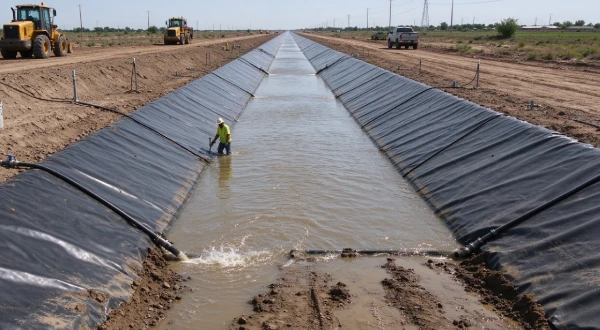
Anchorage design must account for maximum expected flow velocity.
Standard Anchorage (< 1.5 m/s):
| Component | Requirement |
|---|---|
| Trench depth | 0.5–0.6m |
| Trench width | 0.4–0.5m |
| Backfill compaction | ≥ 95% Standard Proctor |
| Anchor spacing | 1.0–1.5m |
| Batten bars | Optional |
Enhanced Anchorage (1.5–2.0 m/s):
| Component | Requirement |
|---|---|
| Trench depth | 0.8–1.0m |
| Trench width | 0.5–0.6m |
| Backfill compaction | ≥ 95% Standard Proctor |
| Anchor spacing | 0.8–1.0m |
| Batten bars | Required (0.5–0.8m spacing) |
Textured Anchorage (> 2.0 m/s):
| Component | Requirement |
|---|---|
| Trench depth | 1.0–1.2m |
| Trench width | 0.6–0.8m |
| Backfill compaction | ≥ 95% Standard Proctor |
| Anchor spacing | 0.6–0.8m |
| Batten bars | Required (0.4–0.6m spacing) |
| Liner type | Textured |
Seam Orientation:
- ✅ Parallel to flow: Seams oriented parallel to flow direction minimise drag on seams
- ✅ Avoid perpendicular seams: Perpendicular seams experience higher drag forces
- ✅ Staggered layout: Stagger seam locations to avoid alignment
6️⃣ Textured Liners for High Velocity Applications
Textured liners provide additional interface friction for high-velocity applications.
Textured Liner Benefits:
| Property | Smooth Liner | Textured Liner |
|---|---|---|
| Interface friction | 10–15° | 25–35° |
| Anchorage load reduction | Baseline | 40–60% reduction |
| Velocity capability | < 2.0 m/s | > 2.0 m/s |
| Cost premium | Baseline | +20–40% |
Textured Liner Installation Requirements:
- ✅ Texture verification: Verify texture height (0.25–0.50mm) before installation
- ✅ Texture removal: Remove texture from weld zone (100–150mm) before welding
- ✅ Welding parameters: 10–20% higher temperature, 15–25% slower speed
- ✅ Destructive testing: Every 100m (vs 150m for smooth liners)
7️⃣ Mechanical Damage Prevention
Mechanical damage is a leading cause of canal liner failure (25–30%).
Mechanical Damage Sources:
| Source | Frequency | Prevention |
|---|---|---|
| Equipment access | 40–50% | Designated access ramps with protective mats |
| Debris in flow | 25–30% | Debris removal upstream |
| Animal activity | 10–15% | Fencing, deterrents |
| Vandalism | 5–10% | Security, community engagement |
Prevention Measures:
- ✅ Access ramps: Designated ramps with geotextile or plywood protection
- ✅ Debris removal: Upstream trash racks or sediment basins
- ✅ Protective covers: Cover exposed sections during maintenance
- ✅ Thicker liners: 1.5mm for high-access areas
- ✅ Geotextile protection: 400–600 gsm for high-damage areas
8️⃣ Real Engineering Failure Cases
Case 1: Anchorage Failure from High Flow Velocity — Indian Canal, 2018
Specification used: 0.75mm HDPE, standard anchorage (0.6m trench, no batten bars). Flow velocity 2.2 m/s during monsoon season.
Observed failure: Liner uplift and displacement during high-flow event. Seam separation at anchorage points. Leakage through failed seams.
Timeline:
text
2018 (Year 0): 0.75mm HDPE installed, standard anchorage
2018-2019 (Years 0-1): Normal operation, velocity 1.0-1.5 m/s
2019 (Year 1): Monsoon season, velocity 2.2 m/s
2019 (Year 1): Liner uplift, seam separation, leakage
2019-2020: Liner replacement with 1.0mm + enhanced anchorage
Cost: $1.5M (liner replacement + enhanced anchorage + water loss)
Root cause: Insufficient anchorage design for high flow velocity (2.2 m/s). Drag forces exceeded anchorage capacity. Seam separation occurred at anchorage points.
Engineering lesson: Design anchorage for maximum expected flow velocity. For velocities > 1.5 m/s, use enhanced anchorage (trench + batten bars). Consider 1.0–1.5mm thickness for high-velocity canals.
Case 2: Mechanical Damage from Equipment — US Southwest Canal, 2017
Specification used: 1.0mm HDPE, 200 gsm geotextile. Subgrade particles up to 25mm. Heavy equipment access for maintenance.
Observed failure: Multiple punctures within 2 years during maintenance. Leakage through puncture points.
Timeline:
text
2017 (Year 0): 1.0mm HDPE installed, 200gsm geotextile
2017-2019 (Months 0-24): Equipment access for maintenance
2019 (Month 24): Multiple punctures detected, leakage
2019-2020: Liner replacement with 1.5mm + 400gsm geotextile
Cost: $0.9M (liner replacement + geotextile upgrade + water loss)
Root cause: Subgrade particles exceeded specification (25mm vs required ≤ 6mm). 200 gsm geotextile provided insufficient protection. Equipment access increased puncture risk.
Engineering lesson: Enforce subgrade particle size ≤ 6mm. Specify 400–600 gsm geotextile for canals with equipment access. Consider 1.5mm thickness for heavy access requirements.
Case 3: UV Degradation from Exposed Service — Central Asian Canal, 2015
Specification used: 0.75mm HDPE, carbon black 2.0%, dispersion rating 2. Exposed canal with continuous UV exposure. Temperature range 5–45°C.
Observed failure: Surface embrittlement after 4 years. Cracking at exposed liner surface. Leakage through cracks during operation.
Timeline:
text
2015 (Year 0): 0.75mm HDPE installed, carbon black 2.0%
2015-2019 (Years 0-4): Continuous UV exposure, surface embrittlement
2019 (Year 4): Cracking detected, leakage through cracks
2019-2020: Liner replacement with 1.0mm + carbon black 2.5%
Cost: $1.2M (liner replacement + water loss + monitoring)
Root cause: Insufficient carbon black (2.0%) and poor dispersion (rating 2) for continuous UV exposure. Surface embrittlement occurred within 4 years.
Engineering lesson: Specify carbon black 2.5–3.0% with dispersion rating ≥ 1 for exposed canal liners. Consider 1.0–1.5mm thickness for extended service life.
Failure Case Cost Summary
| Case | Location | Failure Mode | Cost | Primary Lesson |
|---|---|---|---|---|
| Case 1 | India | Anchorage failure | $1.5M | Enhanced anchorage for > 1.5 m/s |
| Case 2 | US Southwest | Mechanical damage | $0.9M | Subgrade ≤ 6mm, 400-600 gsm geotextile |
| Case 3 | Central Asia | UV degradation | $1.2M | Carbon black ≥ 2.5%, dispersion ≥ 1 |
9️⃣ Comparison With Alternative Liner Systems
| Property | HDPE (1.0mm) | LLDPE (1.0mm) | PVC (1.0mm) | EPDM (1.0mm) | GCL |
|---|---|---|---|---|---|
| Equivalent puncture resistance | ≥ 200 N | ≥ 150 N | ≥ 100 N | ≥ 100 N | ≤ 80 N |
| Chemical durability (irrigation) | Excellent | Good | Poor | Fair | Good |
| Temperature tolerance | -40°C to 80°C | -40°C to 70°C | -20°C to 60°C | -40°C to 80°C | -40°C to 70°C |
| Flexibility (modulus, MPa) | 800–1000 | 400–600 | 50–150 | 5–15 | N/A |
| Field weldability | Excellent | Excellent | Good (solvent) | Poor | N/A |
| UV resistance | Excellent | Moderate | Poor | Good | N/A |
| Anchorage requirements | Standard | Standard | Enhanced | Enhanced | N/A |
| Cost relative to HDPE | 1.0x | 1.0–1.1x | 1.2–1.5x | 2.0–3.0x | 0.6–0.8x |
Table scrolls horizontally on mobile
🔟 Cost Considerations for Anchorage
Anchorage Cost by Velocity:
| Velocity | Anchorage Type | Cost per m (canal length) |
|---|---|---|
| < 1.5 m/s | Standard trench | $15–25 |
| 1.5–2.0 m/s | Enhanced (trench + batten) | $30–45 |
| > 2.0 m/s | Textured + enhanced | $50–75 |
Lifecycle Cost Comparison (25-year):
| Anchorage Type | Initial Cost per km | 25-year Maintenance | 25-year Risk Cost | Total 25-year Cost |
|---|---|---|---|---|
| Standard | $20,000 | $15,000 | $100,000 | $135,000 |
| Enhanced | $35,000 | $10,000 | $30,000 | $75,000 |
| Textured + Enhanced | $60,000 | $8,000 | $15,000 | $83,000 |
Risk Cost of Anchorage Failure:
- Minor displacement (< 10m): $20,000–50,000
- Moderate displacement (10–50m): $100,000–300,000
- Major failure (> 50m): $400,000–1,500,000
1️⃣1️⃣ Professional Engineering Recommendation
Decision Matrix for Canal Liner Anchorage:
| Condition | Velocity | Anchorage Type | Liner Type | Trench Depth |
|---|---|---|---|---|
| Low risk: Small canal, low velocity | < 1.0 m/s | Standard | Smooth | 0.5–0.6m |
| Moderate risk: Standard canal | 1.0–1.5 m/s | Standard | Smooth | 0.5–0.6m |
| High risk: Large canal, high velocity | 1.5–2.0 m/s | Enhanced | Smooth | 0.8–1.0m |
| Extreme risk: High velocity, monsoon | > 2.0 m/s | Textured + Enhanced | Textured | 1.0–1.2m |
Table scrolls horizontally on mobile
When Composite Liner (HDPE + GCL) Required:
- Canals within 300m of water bodies
- Areas with high groundwater
- Regulatory mandate (some jurisdictions)
- Critical containment (drinking water protection)
QA Requirements:
- ✅ Third-party CQA: Independent engineer on-site during installation
- ✅ Anchorage verification: Trench depth, batten bar spacing, anchor spacing
- ✅ Subgrade verification: Photographic documentation every 500 m², compaction testing
- ✅ Material certification: GRI-GM13 compliance certificate, HP-OIT test results
- ✅ Seam testing: 100% non-destructive + destructive every 150m (GRI-GM19)
- ✅ Leak location survey: Electrical leak location (ASTM D7703) for critical canals
- ✅ Documentation retention: All records for lifetime of facility
Critical Statement: Quality assurance outweighs thickness alone. A 1.0mm liner with proper anchorage and rigorous CQA will outperform a 1.5mm liner with inadequate anchorage.
1️⃣2️⃣ FAQ Section
Q1: What flow velocity requires enhanced anchorage?
Standard trench anchors are sufficient for velocities < 1.5 m/s. For 1.5–2.0 m/s, enhanced anchorage (deeper trench + batten bars) is required. For velocities > 2.0 m/s, textured liners are recommended.
Q2: How is drag force calculated for canal liners?
Drag force is calculated as F = 0.5 × ρ × V² × Cd × A, where ρ is water density, V is velocity, Cd is drag coefficient, and A is wetted area. Drag force increases with velocity squared.
Q3: What is the maximum velocity for HDPE canal liners?
HDPE canal liners can accommodate velocities up to 2.5 m/s with proper anchorage and textured liners. Velocities > 2.5 m/s require site-specific design and may require alternative materials.
Q4: How does anchorage design differ for high-velocity canals?
High-velocity canals require: deeper trench anchors (1.0–1.2m), batten bars at regular intervals, textured liners for additional friction, and seam orientation parallel to flow direction.
Q5: What is the role of batten bars in canal anchorage?
Batten bars distribute drag forces along the anchorage system. They are required for velocities > 1.5 m/s and prevent localised stress concentrations at anchor points.
Q6: How do textured liners improve high-velocity performance?
Textured liners increase interface friction between the liner and subgrade, reducing the anchorage load. They are recommended for velocities > 2.0 m/s.
Q7: What causes mechanical damage in canal liners?
Mechanical damage sources include: equipment access for maintenance, debris in flow, animal activity, and vandalism. Equipment access is the leading cause (25–30% of failures).
Q8: How can mechanical damage be prevented?
Mechanical damage prevention includes: designated access ramps with protective mats, debris removal upstream, protective covers for exposed sections, and thicker liners (1.5mm) for high-access areas.
Q9: What CQA requirements apply to canal liner anchorage?
CQA requirements include: anchorage depth verification, batten bar spacing verification, anchor spacing verification, and pullout testing for critical anchors.
Q10: How does seepage control economics justify liner cost?
Unlined canals lose 30–50% of conveyed water. Lined canals lose < 1%. Water savings typically recover liner cost within 3–7 years, depending on water value.
1️⃣3️⃣ Technical Conclusion
Irrigation canal liner anchorage design requires specification discipline that accounts for the unique exposure conditions of exposed water conveyance infrastructure. The combination of flow velocity drag forces, mechanical damage risk, and continuous UV exposure creates a challenging environment for HDPE geomembranes, with anchorage failure and mechanical damage being the dominant failure mechanisms.
Flow velocity is the primary determinant of anchorage design. Drag force increases with velocity squared, so a 2.0 m/s flow creates four times the drag force of a 1.0 m/s flow. Standard trench anchors are sufficient for velocities < 1.5 m/s. For 1.5–2.0 m/s, enhanced anchorage with batten bars is required. For velocities > 2.0 m/s, textured liners provide additional interface friction to reduce anchorage load.
Anchorage design must account for maximum expected velocity, not average operating conditions. The Indian case demonstrates that a 2.2 m/s monsoon flow event can cause $1.5M in damage when anchorage is designed for normal operating conditions. Design for peak flow velocity, including monsoon and flood events.
Mechanical damage prevention is equally critical. Equipment access for maintenance is the leading cause of mechanical damage. Designated access ramps with protective mats, debris removal upstream, and 1.5mm thickness for high-access areas reduce damage risk. Subgrade particles must be ≤ 6mm, with 400–600 gsm geotextile protection.
Lifecycle cost analysis demonstrates that enhanced anchorage is cost-effective. The incremental cost of enhanced anchorage ($15,000–25,000 per km) is far lower than the cost of anchorage failure ($400,000–1,500,000). Water savings from reduced seepage typically recover liner cost within 3–7 years, depending on water value.
📚 Related Technical Guides
- Irrigation Canal Liner Thickness Selection: 0.75mm vs 1.0mm vs 1.5mm
- HDPE UV Resistance for Exposed Liners: Carbon Black Specification
- HDPE Thermal Expansion and Contraction: Canal Liner Applications
- HDPE Anchor Trench Failure: Mechanisms and Prevention
- Irrigation Canal CQA Programs: Inspection Frequency and Documentation